My October Investment Commentary (KC Royals) included a graph illustrating the S&P 500 Index’s growth since 1985. In that graph, I pointed out high and low points and suggested that we might be currently near a high point.
Statistics (and graphs made from statistics) can be deceiving. Chris Harrington, our senior portfolio manager, pointed out to me that the graph I used in October wasn’t logarithmic. In other words, an increase from 500 to 1,000 (an increase of 100%) looks exactly like an increase from 1,000 to 1,500 (an increase of only 50%).
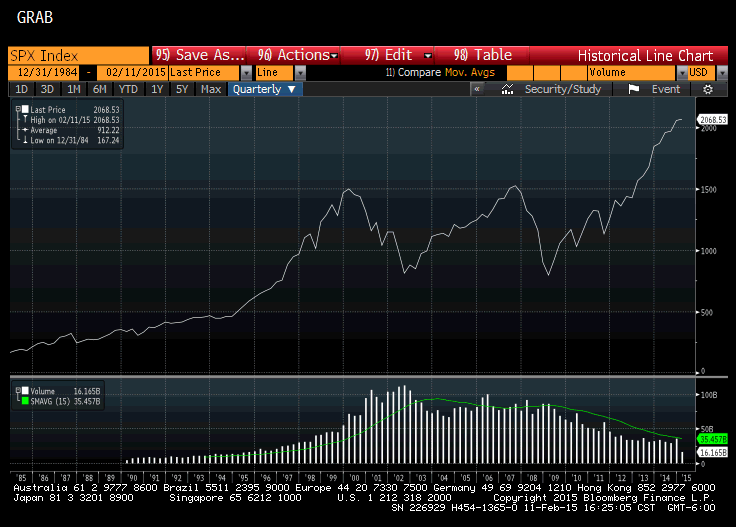
The graph below is similar to the one I published in October. The S&P 500 is plotted from 1985 through the end of 2014. The climb at the end would lead you to believe the market is grossly overvalued.

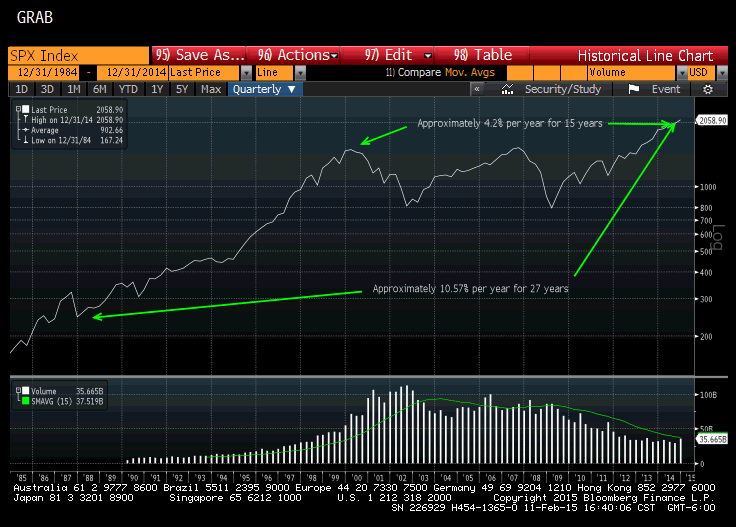
However, when you plot the exact same data on a logarithmic graph, it looks like this:

Since 1987, the annual total return for the S&P 500 has been 10.5% per year, which is pretty close to the long-term historical return for the S&P 500.
However, since the tech bubble peak at the end of 1999, the annual return has only been about 4.2% per year. I’m not suggesting that we should expect six more years of a stock market rally. But I don’t think it’s a slam dunk that this market is going to sell off because it is “overbought.” It may have a long way to go before it is overbought.
January proved to be a difficult month for the U.S. stock market with the S&P 500 declining 3%. The All World Index (ex U.S.) barely recorded a negative return of -.21%. For the prior 12-month period ending January 31st, the S&P 500 increased over 14% and foreign markets declined almost 2%.
The market rallied the first five days of February, completely erasing January’s loss. Since then the market has continued to rally, hitting new highs.
Interest rates fell even lower in January. The 10-year U.S. Treasury bond traded as low as 1.64%, although it has popped back up a little in February, currently just over 2%. If you’re still looking for that spike in interest rates… I think we might have a woman for president before that happens.
The fact is that the 10-year Treasury bond is a relatively attractive investment. The long-standing slowdown in the European economy has eliminated immediate threats of inflation. Sovereign bonds in Europe are trading at much lower interest rates than in the U.S.
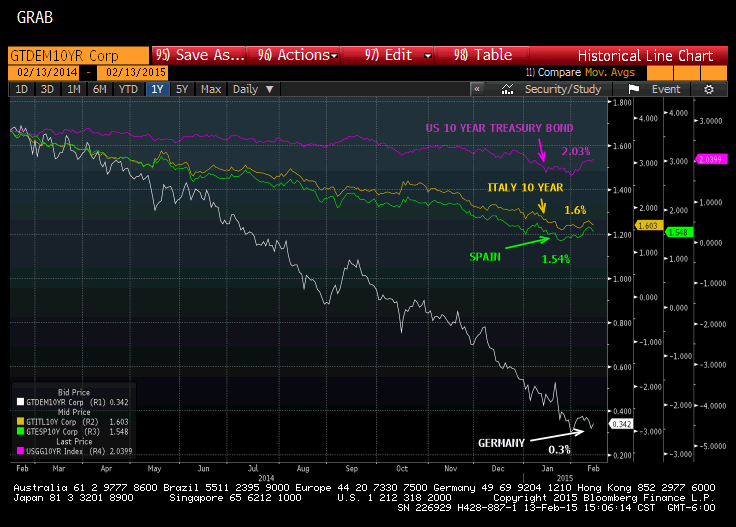
The graph below shows the U.S. 10-year bond at 2.03%, while the German 10-year bond has an interest rate of 0.3%. ZERO POINT THREE PERCENT! With even a whiff of inflation, investors in the German bond will get a negative “real” rate of return. Italy and Spain bonds are trading somewhere in between.

An international investor faced with these four choices would likely invest in U.S. bonds with the higher interest rate. Until we see some solid growth in the Eurozone, we are likely to continue to see low interest rates. And as long as we see low interest rates in the Eurozone, we will continue to see downward pressure on U.S. interest rates. In addition, the European Central Bank (ECB) has elected to execute their own form of Quantitative Easing by purchasing bonds in the open market, thereby ensuring that interest rates will remain low for a long time.
In addition to all of the above, the Federal Reserve Open Market Committee met this week. Bottom line: even though the most recent employment report was stronger than expected, there was no clear signal from the meeting’s minutes that would lead you to believe they will begin raising the Fed Funds rate any time soon, and maybe not until after summer.
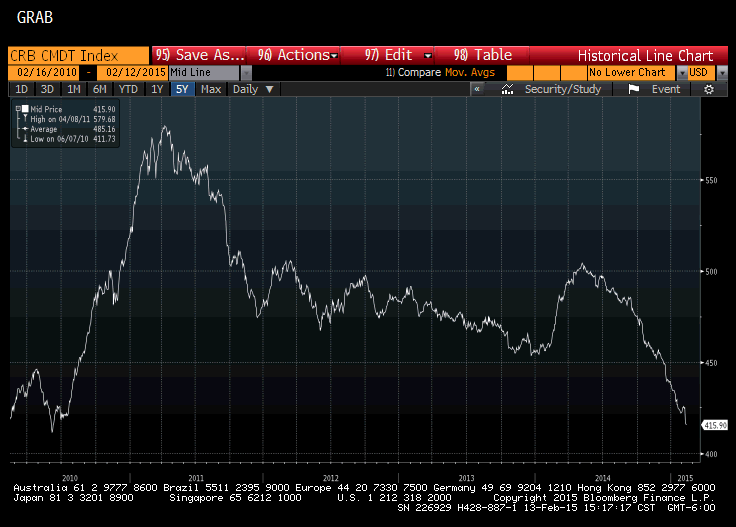
If you are still convinced that we are going to experience hyperinflation and higher interest rates, take a look at a 5-year graph of the CRB Index (Commodities Research Bureau Index of the spot price of 22 basic commodities). The index is almost at a 5-year low.

Oil, copper, gold, coffee and a host of other commodities are either hitting 52-week lows or are well below their high prices of early 2014.
Ebola has been completely eliminated as a threat to worldwide order, giving the stock markets one less major uncertainty to worry about. The Middle East is nearly as quiet as the Middle East ever gets. The Eurozone is always somewhat of a concern, but the issue with Greece has been kicked down the road for four more months. And the U.S. dollar is as strong as ever, which as I have explained before is a positive sign, but it is a negative for many companies who do business overseas.
All in all, it is an environment that is good for stocks. Investors will probably find easy reasons to buy stocks and drive prices higher.
At Boyer & Corporon Wealth Management, we have been hedging our positions in stocks. However, the calm environment makes us less concerned about owning stocks. We are not significantly increasing our equity exposure, but we don’t feel the need to hedge.
Although the overall duration of our fixed income has declined slightly over the past few months, we still own an unusual amount of long duration bonds because we don’t expect a significant increase in interest rates.
This information is provided for general information purposes only and should not be construed as investment, tax, or legal advice. Past performance of any market results is no assurance of future performance. The information contained herein has been obtained from sources deemed reliable but is not guaranteed.
