In our industry, we look for warning signs of impending bad economic times, signs that might help us run for cover before the markets get ugly.
One of the warning signs that has traditionally been pretty reliable is called an “inverted yield curve.” This signal has preceded every U.S. recession for the past 60 years.
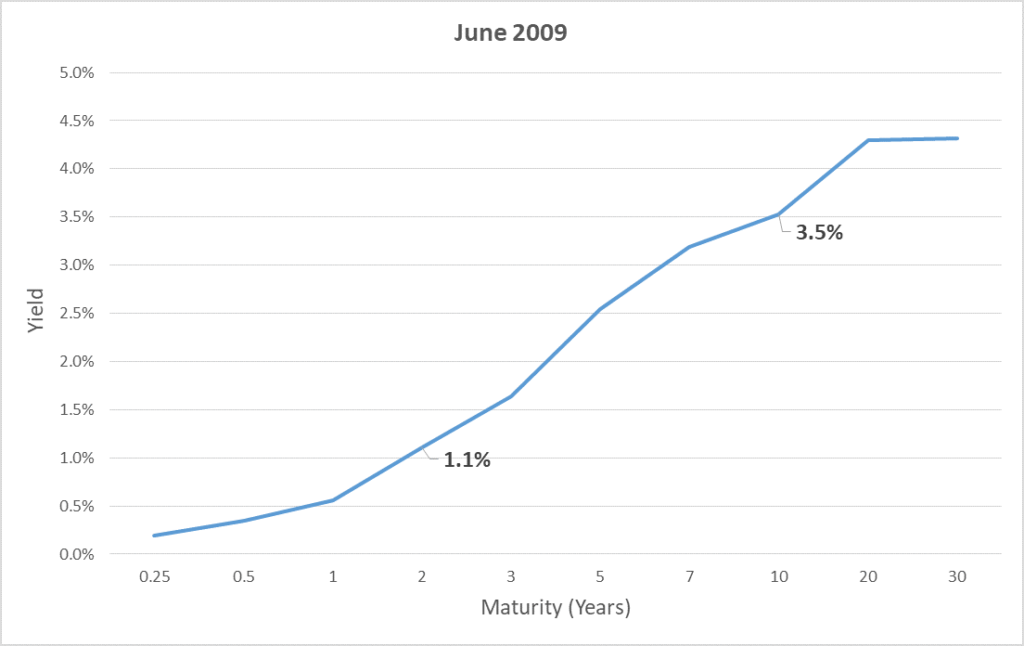
Typically, investors are paid a higher rate of interest when they invest their money for a longer period of time. For example, in June, 2009, when the most recent expansion began, if you invested in U.S. Treasuries for 10 years, you earned 3.5% per year while if you only invested for two years, you only received 1.1% per year. That “normal yield curve” looked like this:

In the graph, we point out the rates of the 10-year and 2-year Treasuries, but the line itself represents the rates you would receive for holding Treasuries of all maturities up to 30 years. Historically, an upward-sloping curve has been associated with positive economic sentiment. Investors believe the economy will grow, which causes a normal level of inflation, and the Federal Reserve then raises short-term interest rates predictably over time. Not only do investors require a higher return for locking up their money longer, they want to be compensated for future inflation.
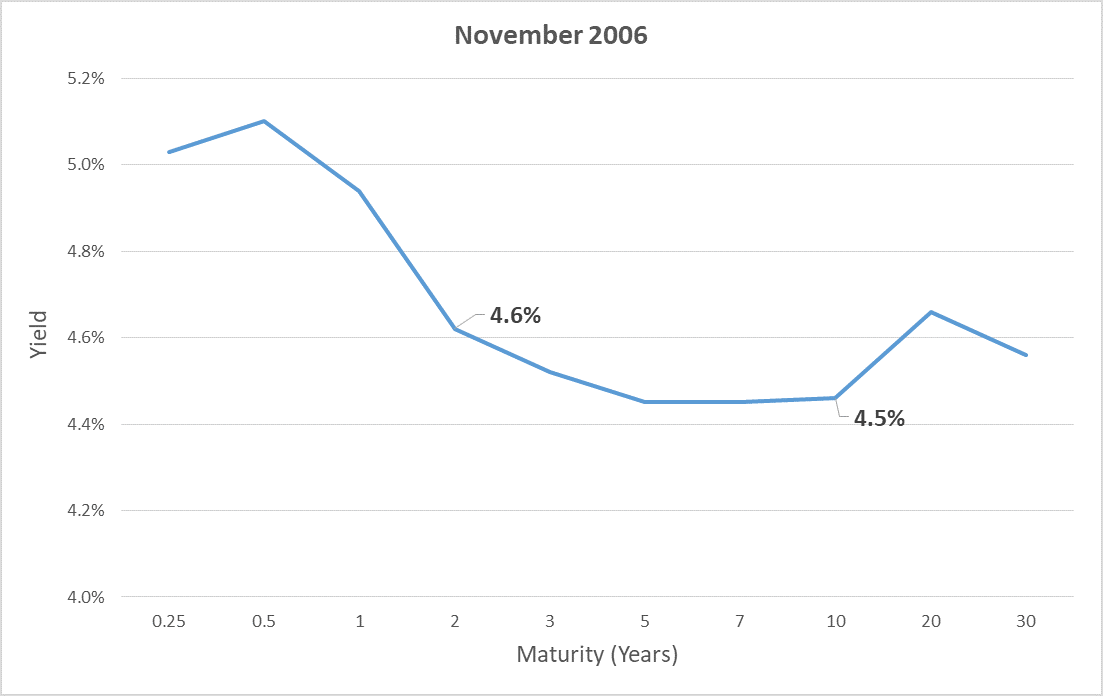
When investors expect a worsening economy, and potentially deflation, the curve begins to flatten and it sometimes even “inverts.” We saw this in November, 2006, when the 10-year U.S. Treasury note paid 4.5% while the 2-year Treasury note paid 4.6%. The inverted yield curve looked like this:

The inverted yield curve is very counterintuitive. Why would investors settle for a lower return when they are locking up their money for a longer period?
There are many factors at play here, but the main reason is that investors believe the Federal Reserve will cut short-term interest rates in the future. Investors would rather lock in today’s low rate because they believe tomorrow’s rate will be even lower.
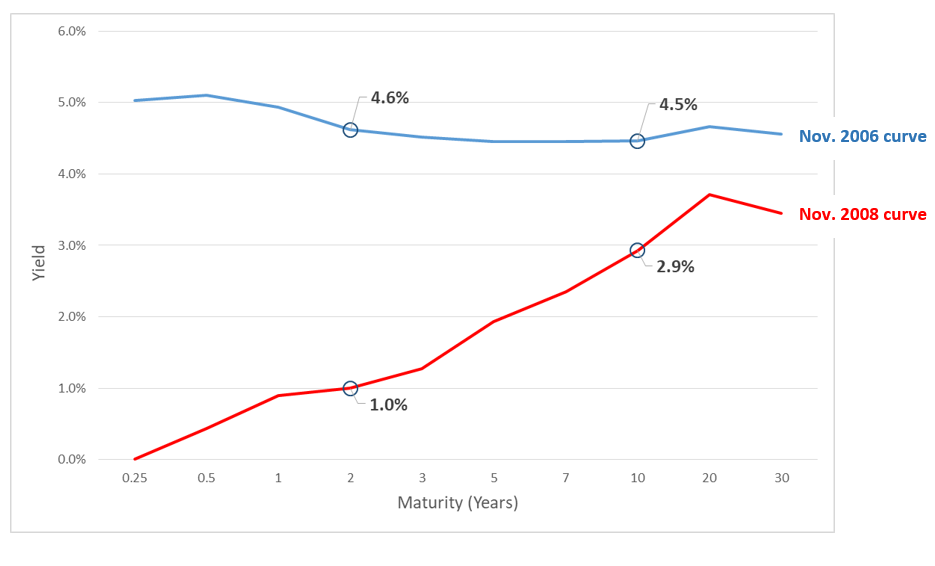
And the investor who locked in the lower 4.5% interest rate in 2006 made the right decision, as you can see in the chart below. Interest rates dropped meaningfully over the next two years. The investor who purchased the 2-year Treasury note in 2006 was only able to reinvest their proceeds in November 2008 at a rate of 1%. Meanwhile, the investor that bought the 10-year note received 4.5% for an additional eight years and looked pretty smart.

There is an old adage that the bond market is smarter than the stock market, meaning: pay attention to what’s happening with bonds for indications of what’s to come in the economy and, thus, the stock market. And while yield-curve inversions are not a guarantee that a recession is imminent, historical evidence suggests that you ought to be paying attention.
It should be noted that there are areas of the yield curve that are currently inverted (e.g., the 10-year Treasury note presently yields less than the 3-month Treasury bill), but the most reliable recession-predicting inversion relationship is the 10-year Treasury note vs. the 2-year Treasury note. That measure has not yet inverted during the most recent economic cycle.

This information is provided for general information purposes only and should not be construed as investment, tax, or legal advice. Past performance of any market results is no assurance of future performance. The information contained herein has been obtained from sources deemed reliable but is not guaranteed.
This information is provided for general information purposes only and should not be construed as investment, tax, or legal advice. Past performance of any market results is no assurance of future performance. The information contained herein has been obtained from sources deemed reliable but is not guaranteed.
